All posts (Page 120 of 130)
We just released v0.3 of taxize. For details on the update, see the release notes.
🔗
Some new features
- New function
iplant_resolve()to do name resolution using the iPlant name resolution service. Note, this is different from http://taxosaurus.org/ that is wrapped in thetnrs()function. - New function
ipni_search()to search for names in the International Plant Names Index (IPNI). See below for more. - New function
resolve()that unifies name resolution services from iPlant’s name resolution service (viaiplant_resolve()), Taxosaurus’ TNRS (viatnrs()), and GNR’s name resolution service (viagnr_resolve()). - All
get_functions now returning a new uri attribute that is a link to the taxon on the web. If NA is given back (e.g. nothing found), the uri attribute is blank. You can go directly to the uri in your default browser by doing, for example:browseURL(attr(result, "uri")).
🔗
Updating to v0.3
Since taxize is not updated to v0.3 on CRAN yet at the time of writing this, install taxize from GitHub:
The rOpenSci project is a poster child for the fluid collaboration that has become increasingly common these days thanks to platforms like Twitter and GitHub. It has been really inspring to see open discussions take shape as rough ideas, which rapidly turn into prototype research software, all of which are now happening in the order of few days to weeks rather than months to years. The origins of this project itself lead back to a series of serendipitous conversations that occurred over Twitter three years ago. Today we are a rapidly growing community of scientists, students, software developers, and information researchers....
One of the goals of the rOpenSci is to facilitate interoperability between different data sources around web with our tools. We can achieve this by providing functionality within our packages that converts data coming down via web APIs in one format (often a provider specific schema) into a standard format. The new version of rWBclimate that we just posted to CRAN does just that. In an earlier post I wrote about how users could combine data from both rgbif and rWBclimate. Back then I just thought it was pretty cool that you could overlay the points on a nice climate map. Now we’ve come a long way, with the development of an easier to use and more comprehensive package for accessing species occurrence data, spocc, and added conversion functions to create spatial objects out of both climate data maps, and species occurrence data. The result is that you can grab data from both sources, and then extract climate information about your species occurrence data....
Editor’s note: This is a guest post by Matt Sundquist from Plot.ly.
Ggplotly and Plotly’s R API let you make ggplot2 plots, add py$ggplotly(), and make your plots interactive, online, and drawn with D3. Let’s make some.
🔗
- Getting Started and Examples
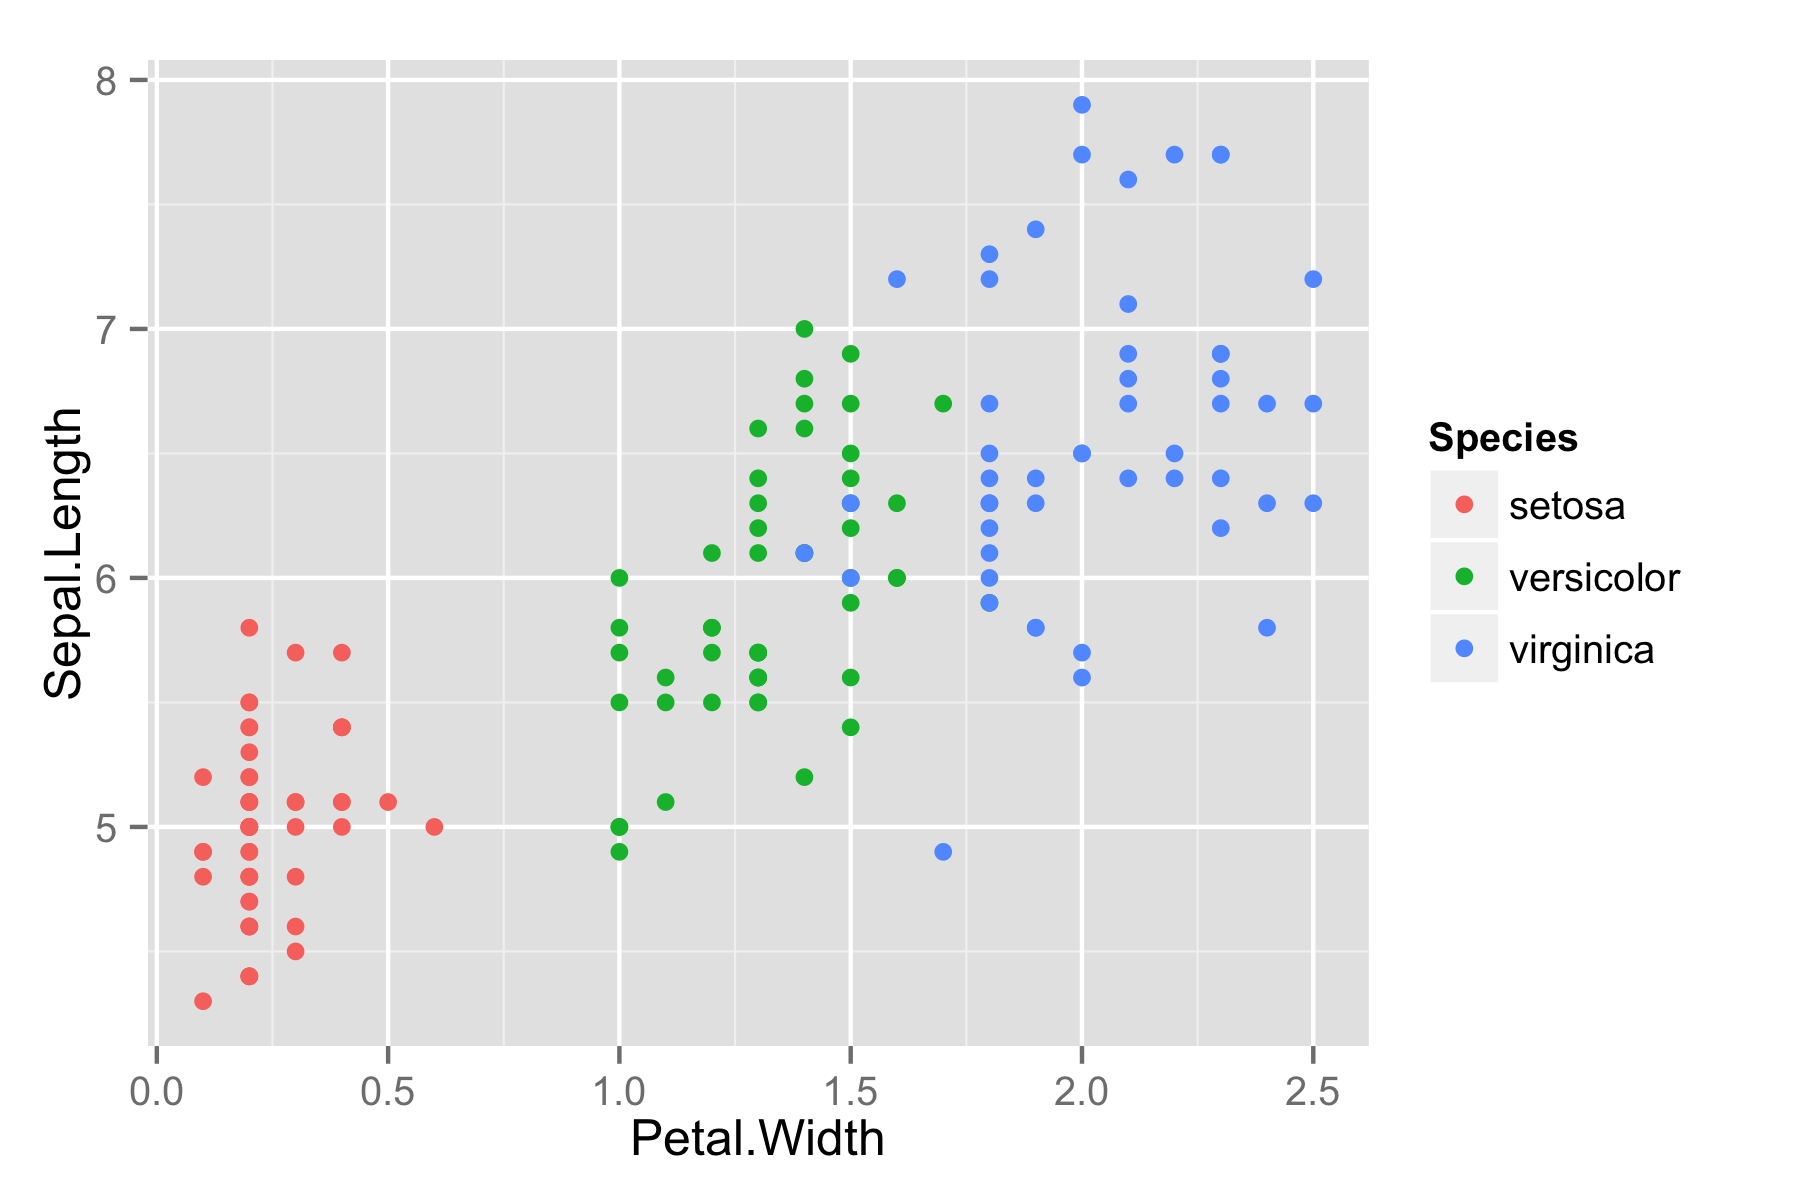
Here is Fisher’s iris data.
library("ggplot2")
ggiris <- qplot(Petal.Width, Sepal.Length, data = iris, color = Species)
print(ggiris)
Let’s make it in Plotly. Install:
install.packages("devtools")
library("devtools")
install_github("plotly", "ropensci")
Load.
library("plotly")
## Loading required package: RCurl
## Loading required package: bitops
## Loading required package: RJSONIO
Sign up online, use our public keys below, or sign up like this:
...
Editor’s note: This is the first in a series of posts from rOpenSci’s recent hackathon.
I recently had the pleasure of participating in rOpenSci’s hackathon. To be honest, I was quite nervous to work among such notables, but I immediately felt welcome thanks to a warm and personable group. Alyssa Frazee has a great post summarizing the event, so check that out if you haven’t already. Once again, many thanks to rOpenSci for making it possible!
...